
TL;DR
Discover the power of generative AI in data analysis with our tutorial on LLMTextAnalysis.jl, a tool that transforms the way you explore and visualize key themes in large text datasets, making deep insights accessible in minutes rather than hours.
GenAI Mini-Tasks: Interactive Topic Explorer With LLMTextAnalysis.jl
Welcome back to our "GenAI Mini-Tasks" series, where we showcase how generative AI can boost everyday tasks. Today, we're excited to introduce a powerful tool that exemplifies this series perfectly: the "Interactive Topic Explorer" using LLMTextAnalysis.jl.
In this instalment, we're focusing on how you can quickly surface the themes at different "levels" in your text datasets (eg, the top 3 themes, sub-themes, individual texts, ...), a task that traditionally requires hours of slicing, dicing, and eventually reading the various texts. With LLMTextAnalysis.jl, you can now gain insights in minutes, transforming the way you interact with large text datasets.
Exploration with LLMTextAnalysis.jl
To power the analyses, LLMTextAnalysis.jl uses large language models to produce "embeddings" (ie, translate texts into vectors of numbers), which allows us to leverage semantic similarity between the texts.
This enables you to:
- Efficiently Identify Key Themes: Extract main themes from your text data swiftly, bypassing the need to read each entry.
- Interactively Explore the Data: Use PlotlyJS to create dynamic, interactive visualizations that make data exploration engaging and insightful. (Looking into supporting Makie.jl as well)
- Adapt the Level of Depth: Tailor your exploration depth based on your needs, from high-level themes to individual texts.
Now, let's dive into how you can use LLMTextAnalysis.jl to explore text data.
Setting Up the Environment
Begin by setting up your Julia environment with the required packages:
using Downloads, CSV, DataFrames
using Plots
using LLMTextAnalysis
plotlyjs(); # recommended backend for interactivity
Install them as necessary (eg, using Pkg; Pkg.add(["LLMTextAnalysis", "Plots", "PlotlyJS"])).
Data Preparation
We'll use a real-world dataset for this example, a community survey for the City of Austin in Texas, US.
Let's download and read the data:
Downloads.download("https://data.austintexas.gov/api/views/s2py-ceb7/rows.csv?accessType=DOWNLOAD",
    joinpath(@__DIR__, "cityofaustin.csv"));
df = CSV.read(joinpath(@__DIR__, "cityofaustin.csv"), DataFrame);
As an example, let's focus on a specific open-ended question for analysis:
col = "Q25 - If there was one thing you could share with the Mayor regarding the City of Austin (any comment, suggestion, etc.), what would it be?"
docs = df[!, col] |> skipmissing |> collect;
Performing Topic Analysis
Create an index of the documents (embeddings):
index = build_index(docs)
Visualizing Topics
Generate interactive visualizations to explore the themes:
pl = plot(index; title = "City of Austin Community Survey Themes", labeler_kwargs = (; model = "gpt3t",))
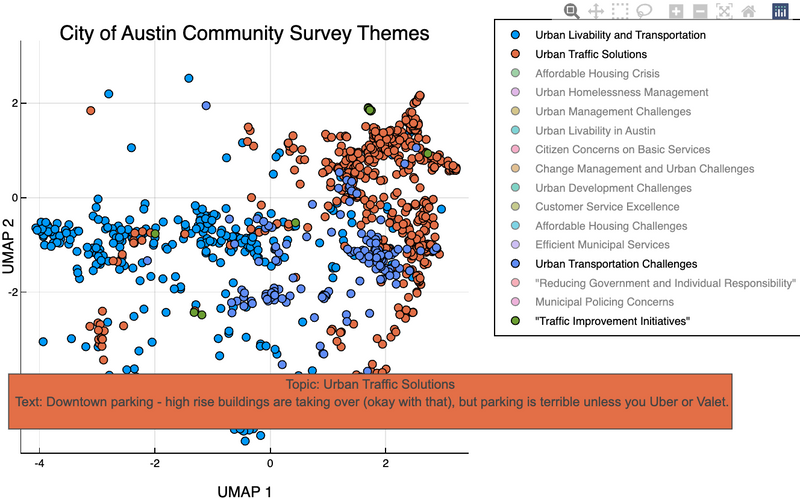
The screenshot doesn't do it justice, so check out the interactive version.
A few words on plot:
- It uses
Plots.jlto create the plot (and PlotlyJS as a backend) - It calls intermediary steps under the hood (clustering, labeling, ...). See the docs for more details.
- You use any keywords that you're used to from Plots.jl, eg, to customize the
titleorsize -
labeler_kwargsallows us to control the LLM labeling of topics, I like the latest GPT-3.5-Turbo-1106 for the labeling. We can use any kwargs from PromptingTools.jl - You can specify the number of topics to show with
k, or the height of the dendrogram to cut at withh(see?Clustering.hclust)
Advanced Tips
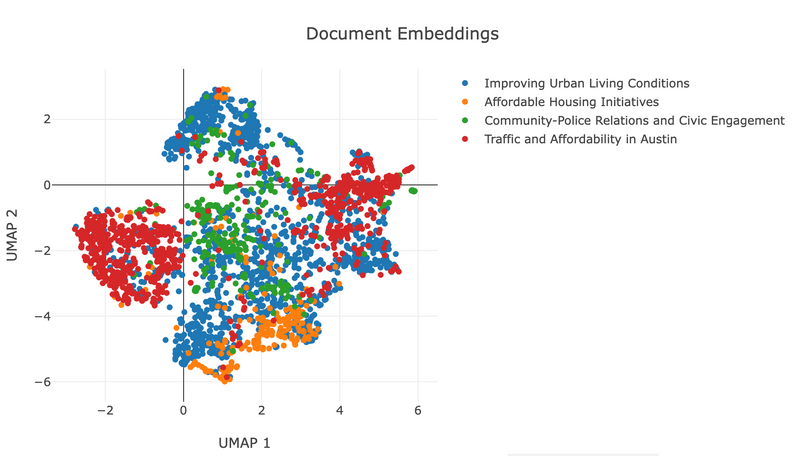
Zooming In/Out on Topic Depth
Adjust the level of thematic detail as needed.
One of the biggest superpowers of LLMs, is that you can zoom in/out in the abstraction level to help you digest information more gradually.
# For example, we can start by looking at the top-level themes with `k=4`:
pl4 = plot(index; k = 4, labeler_kwargs = (; model = "gpt3t"))
pl4
Now, we have both the top-level themes and the sub-themes available in index.topic_levels, so we can easily switch between them.
Serializing the Index
Save your index for future use without reprocessing.
We don't want to recompute the index and topics every time we want to explore it, so we can serialize it to disk and load it back later.
 using Serialization
 serialize("austin-index.jls", index)
 index = deserialize("austin-index.jls")
Interactive Features in PlotlyJS
Engage deeply with your data through interactive visual elements.
Remember that with PlotlyJS backend, you can zoom in/out, pan, and hover over the points to see the document text.
Also, by single-clicking / double-clicking on the topics in the legend, you can hide/show the topics.
Conclusion
The "Interactive Topic Explorer" with LLMTextAnalysis.jl is a prime example of how generative AI together with your existing Julia tools can significantly enhance productivity and insight in data analysis. It's not just a tool; it's a new way to interact with your data, bringing efficiency and depth to your analysis processes.
Stay tuned for more GenAI mini tasks, where we continue to explore practical, impactful uses of generative AI in everyday scenarios!
Credit for the title image goes to DALL-E 3.

Top comments (0)