Here is a quick julia source code for how to plot Logarithmic graphs
using Plots

cases = [10, 31, 47, 93, 109, 109, 171, 222, 266, 348, 399, 415, 430, 553, 619, 702, 827, 918,
919, 919, 1033, 1110, 1247, 1395, 1561, 1648, 1658, 1999, 2106, 2312, 2477, 2748, 2762, 2766, 2938,
3443, 3725, 4019, 4492, 4499, 4504, 4771, 5401, 5611, 6182, 6640, 6651, 6673, 6947, 7667, 7913,
8271, 9482, 9491, 9507, 9860, 10570, 11094, 11930, 13012, 13027, 13053, 13523, 14607, 15668,
16243, 17236, 17263, 17307, 18263, 19314, 20933, 21488, 22863, 22953, 23018, 24009, 25544, 26264,
27178, 28828, 28848, 28856, 31110, 32373, 33820, 34431, 35809, 35916, 35998, 36949, 38714,
40022, 40855, 42039, 42244, 42342, 43691, 44832, 45911, 47114, 48304, 48439, 48446, 49814,
50813, 51726, 52318, 53241, 53522, 53640, 54186, 55269, 56350, 56686, 57682, 57839, 57839,
58046, 59597, 60291, 60835]


function getLogTicks(vector,count=1)
    function poststr(expnum)
        n = Int64(expnum) ÷ 3
        if n == 0
            return ""
        elseif n == 1
            return "k"
        else
            return "×\$10^{$(n*3)}\$"
        end
    end
    min = ceil(log10(minimum(vector)))
    max = floor(log10(maximum(vector)))
    major = [ [k*n for k = 1:count] for n in 10 .^ collect(min:max) ]
    major = hcat(major...)
    major = vec(major)
    major = filter(x->x<=maximum(vector),major)
    #majorText = ["\$10^{$(round(Int64,i))}\$" for i=min:max]
    majorText = ["$(Int64(j*10^(i%3)))$(poststr(i))" for i=min:max for j=1:count]
    majorText = majorText[1:length(major)]
    minor = [j*10^i for i=(min-1):(max+1) for j=(count+1):9]
    minor = minor[findall(minimum(vector) .<= minor .<= maximum(vector))]
    ([major; minor], [majorText; fill("", length(minor))])
end

#
# Now Plot the cases
# using LOGSCALE for the Y-Axis
# We can't take log(0) since it is Minus Infinity
# So we assume any value less than one is one

yticks_scale = getLogTicks( [ k<1.0 ? 1.0 : k    for k in cases ], 6 );

plot(0:length(cases)-1,
    [ k<1.0 ? 1.0 : k    for k in cases ],
    title="Monkeypox Cases",
    linewidth=2, ylabel="Cases",
    yaxis=:log10, yticks=yticks_scale,
    xlabel="days",
    legend=:topleft,label="Monkeypox",
    markershape=:circle,size=(800,700)) |> display
And here is the result.
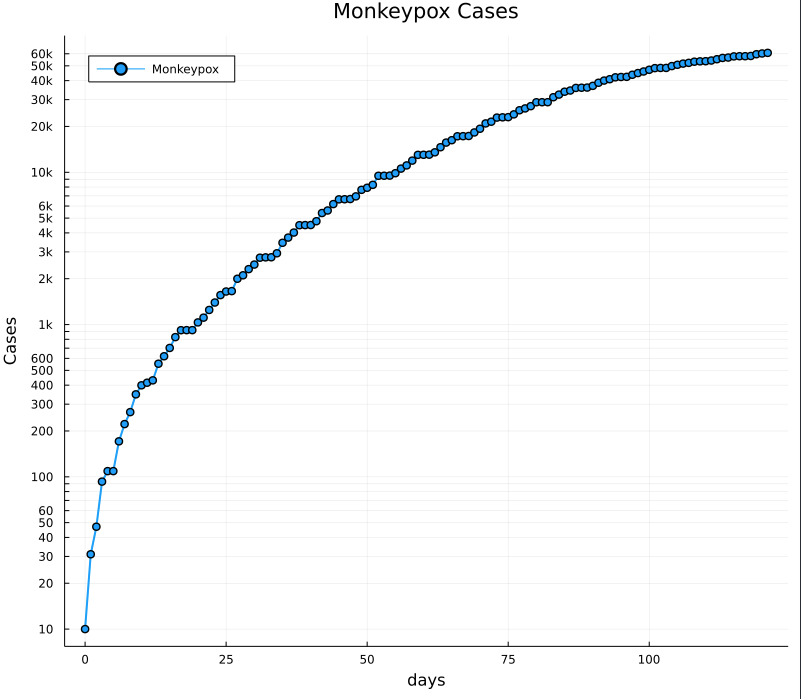
The secret is the function getLogTicks which takes two arguements. The first is the numeric data in a vector format and the second argument is number of text labels on the y-axis.

Top comments (1)
I have a feeling that I've seen this code before.. :)