We've all been starstruck by the images from the NASA Webb telescope. Somehow, some of these images reminded of an old graph visualization I made for the Julia packages dependency graph... So let's talk about a different kind of stars: 💫the Julia packages💫.
The data.
What am I trying to build here? I am trying to build a graph, where every node represents a registered Julia package, and every edge represents the existence of a dependency between two packages. The dependency information can usually be found from the .toml file associated with every package.
The full code I used to generate this graph is here.
Fun fact: when I last did this in October 2020, I found 4446 packages, and the full list is here. But when I did the same task yesterday, I found 7949 packages. More than 3500 packages in less than two years!! 📈📈📈
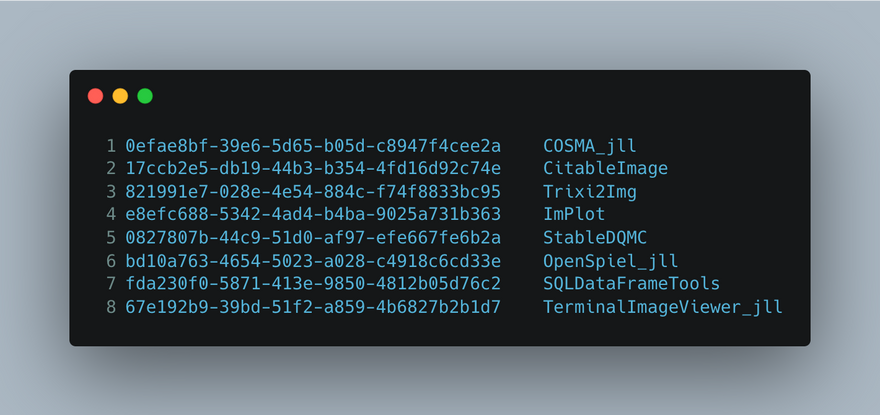
And with that, we have our data... the labels file looks something like this:
Every line corresponds to a package and and the line id, is the node id in the graph. For example, the node id 1 in our graph corresponds to the package COSMA_jll.
The edge list file looks something like this:
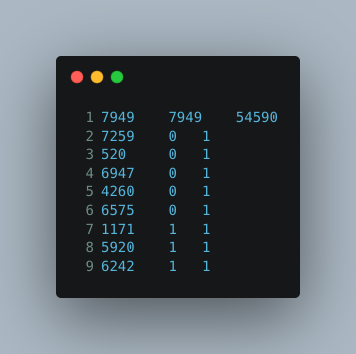
The first line indicates the number of from_nodes, number of to_nodes, and the total number of edges. The remaining lines indicate from node_id, to node_id, weight, in this case all the weights are 1, meaning that this is an unweighted graph.
PageRank.
Now, the fun part! PageRank 🎉.
I used the PageRank implementation from MatrixNetworks.jl, and the code is as simple as something like this:
A = MatrixNetworks.readSMAT("Julia-dependency-graph.smat")
A = max.(A, A') # I make sure the graph is undirected.
p = MatrixNetworks.pagerank(A, 0.85) # Run PageRank.
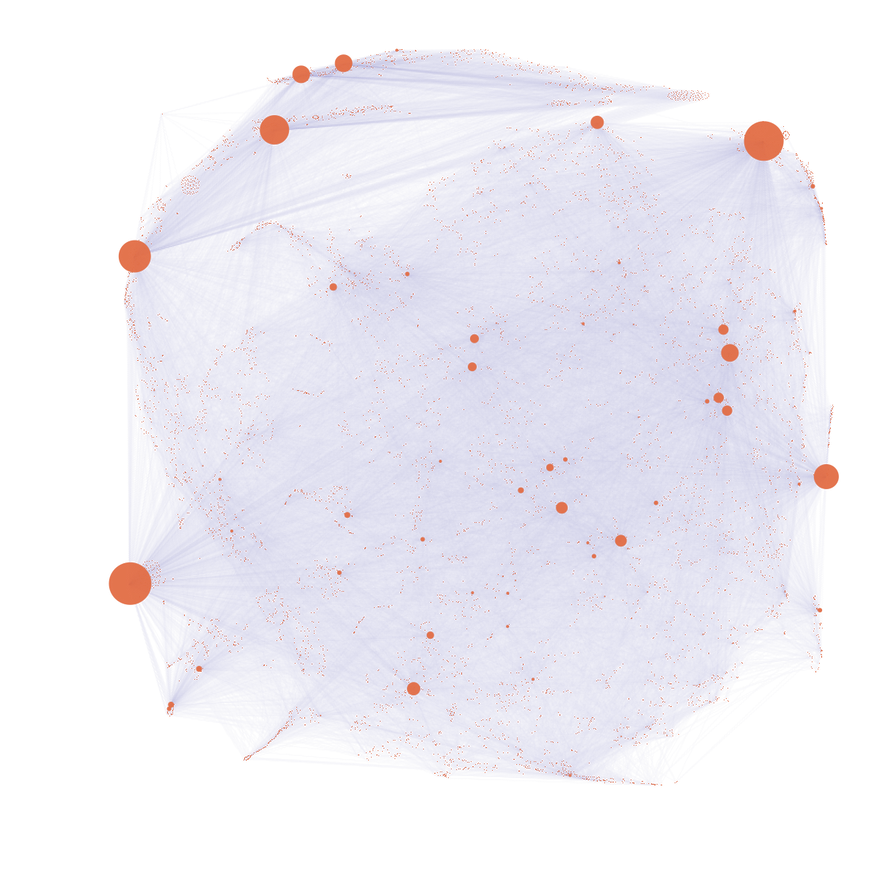
We are almost ready... we have the PageRank values for every node, and we can manually inspect them... but wouldn't it be fun to visualize the graph as well? For this, I use the algorithm GLANCE (from this paper).
Now we have all the components:
The nodes, and their corresponding (x,y) coordinates (from GLANCE) and their corresponding PageRank values (from MatrixNetworks)... What remains is to plot the graph with the node sizes corresponding to the PageRank values.
And... tada... there it is: PageRank on the julia package dependency graph!!
Now of course, the curious minds are wondering, what are the highest packages with the highest PageRank values? Here are the top 15:
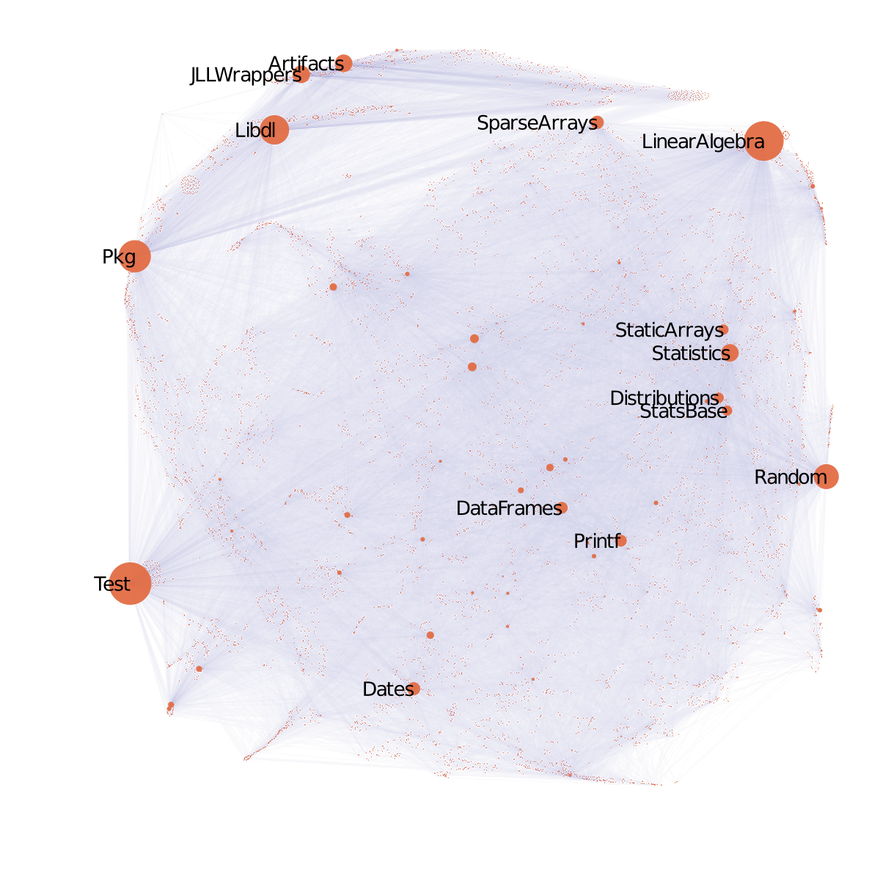
Pretty cool, no?! Another thing to notice is how some related packages ended up sitting close to each other -- this is thanks to the power of GLANCE. If you zoom in, you can notice that there are packages clustered together too. Upon manual inspection, I noticed that many Biology related packages clustered together, JuMP related packages clustered together, and there were a few other categories... maybe that will be the topic of a future blogpost :).

Top comments (7)
Nice! We have similar interests ... cormullion.github.io/Karnak.jl/dev...
😀
Ah! How did I not know about this? 😭
Will try it out 😀
👍🏻Cool, it worked a few months ago... 🤣 There are some files in the examples folder which might still work...
Honestly I love this because it kind of illustrates how numerical the whole Julia ecosystem is -- LinearAlgebra.jl is an absolute monolith
💯
This is AWESOME Huda! Great work.
Thanks Logan, glad you enjoyed it :).