This is the first of a series of posts on k-means clustering. In this post, we will focus on k-means clustering in its simplest form, commonly referred to as naïve k-means. In future posts, we will gradually improve this version by better understanding its inner workings and looking at it from a different angle.
The goal of k-means clustering is to partition a set of observations into clusters. An observation corresponds to a point in a multidimensional space. Intuitively, each cluster can be thought of as a group of points that lie close to each other around its mean The goal of k-means clustering is to find an assignment of points to clusters that minimizes the sum of the squared Euclidean distances of each point to its closest mean We can do this through an iterative procedure involving two steps:
- Assign each point
to its nearest cluster
with mean
:
- Update the cluster means :
This two-step iterative procedure is repeated until convergence. Note that before we can start iterating, we need to choose initial values for the means One common approach is to set them to a random subset of observations. For the moment, we suppose that the value of is given.
Let us now look at an implementation using the Julia language.
We start start by importing the necessary packages: Plots.jl to visualize the result, RDatasets.jl to load the Iris flower data set, Distances.jl to use its squared Euclidean distance implementation and, Statistics.jl to use its mean implementation. We then load two features of the dataset into a matrix. For illustration purposes we will use two features. Note, however, that k-means clustering works with data of any number of dimensions. Finally, we choose an arbitrary value for
using Plots, RDatasets, Distances, Statistics
pyplot(leg=false, ms=6, border=true, fontfamily="Calibri",
       title="Naïve k-means")             # plot defaults
iris = dataset("datasets", "iris");       # load dataset
𝐱ₙ = collect(Matrix(iris[:, 1:2])');      # select features
K = 3                                     # number of clusters
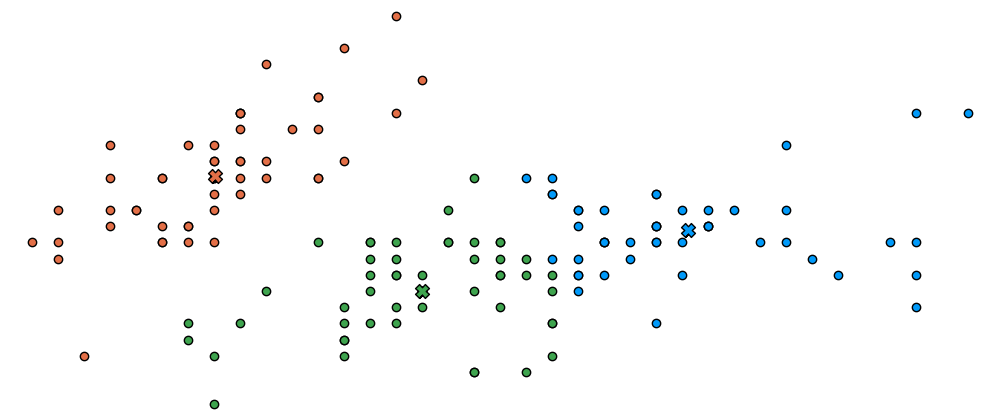
Let's define a function to visualize the cluster points
and the means
Let's also represent the assignment of points to clusters
using the marker's color.
function plot_clusters(𝐱ₙ, 𝛍ₖ, kₙ)
  plt = scatter(𝐱ₙ[1,:], 𝐱ₙ[2,:], c=kₙ)
  scatter!(𝛍ₖ[1,:], 𝛍ₖ[2,:], m=(:xcross,10), c=1:size(𝛍ₖ,2))
  return plt
end
Last but not least, an elegant but naïve k-means implementation:
# Initialize the means for each cluster
𝛍ₖ = 𝐱ₙ[:, rand(axes(𝐱ₙ, 2), K)]

anim = @animate for _ in 1:15

  # Find the squared distance from each sample to each mean
  d = pairwise(SqEuclidean(), 𝐱ₙ, 𝛍ₖ, dims=2)

  # 1. Assign each point to the cluster with the nearest mean
  kₙ = findmin(d, dims=2)[2] |> x -> map(i -> i.I[2], x)

  # 2. Update the cluster means
  for k in 1:K
    𝐱ₙₖ = 𝐱ₙ[:, dropdims((kₙ .== k), dims=2)]
    𝛍ₖ[:, k] = mean(𝐱ₙₖ, dims=2)
  end

  plot_clusters(𝐱ₙ, 𝛍ₖ, kₙ)

end

gif(anim, joinpath(@__DIR__, "anim.gif"), fps=2)
K-means clustering is one of the simplest and most popular unsupervised machine learning algorithms used to discover underlying patterns by grouping similar data. In this post, we studied the mechanics of this method in its simplest form. However, a number of questions remain unanswered. For example, how did we arrive to the equations describing the two-step iterative procedure? Is it guaranteed to converge? What are the shortcomings of k-means clustering as implemented here? Can we give a meaningful interpretation to this problem that gives us a deeper understanding as to what is actually happening in the iterative procedure? If so, can such interpretation provide us with tools to modify and improve the mechanism presented here? Stay tuned.

Top comments (3)
I read your other articles also. You have a nice conversational style. Are you considering putting the complete code of each article in a repo?
Hey @akvsak. Thanks for the kind words! Sure, I could do that, here you go: github.com/mroavi/julia-forem
thanks. I followed your repo. I will use it to study your articles. 👏