In the past, many users requested more interactivity for GR console applications. Embedding GR in Qt/QML applications or in browser environments (via JavaScript) seemed too complex for most users. With the current version we have improved this.
For this reason, a new library was developed that was designed from the beginning to provide the basic functionality for interactive graphics applications. What was previously reserved for GUI or web applications can now be used in console applications without changing any script.
To use this functionality, it is sufficient to set an environment variable before starting Julia:
GRDISPLAY=plot julia
Of course, this can also be done directly in the Julia scripts before importing the GR package.
ENV["GRDISPLAY"] = "plot"
using GR
A simple example
using GR
plot(randn(20,5), labels=("a", "b", "c", "d", "e"))
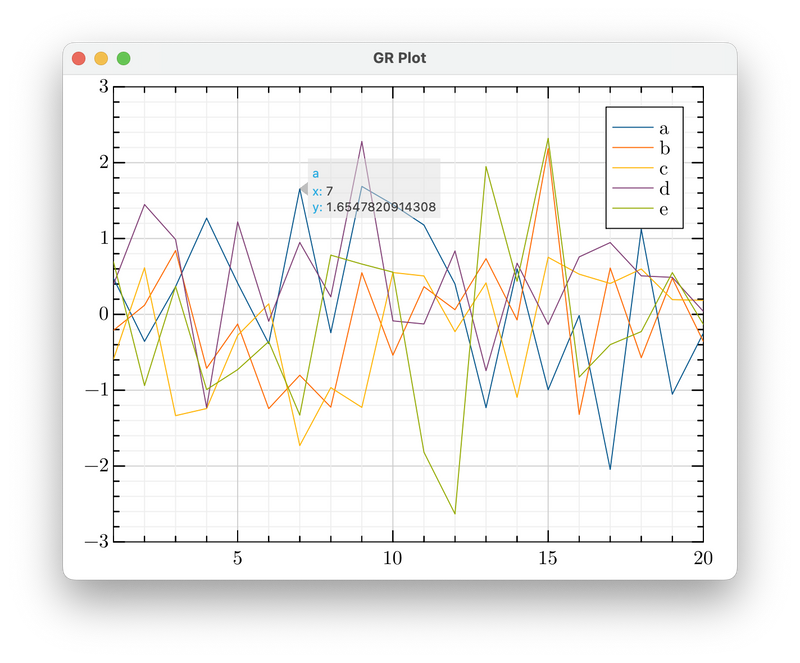
The plot can be zoomed or panned with the mouse wheel - regions of interest can be selected (with the right mouse button) and reset (with a double click), and the corresponding X and Y coordinates are displayed when moving over the points. Reducing and enlarging the entire plot is of course also possible.
Of course, this also works with a well-known example:
using GR
using DelimitedFiles

data = readdlm("covid19.csv", ',')

ncountries, ncols = size(data)
ndays = ncols - 4

countries = ["Germany", "Austria", "Belgium", "Netherlands", "France", "Italy", "Spain", "US"]

cummulated = Dict()
for i in 1:ncountries
        country = data[i,2]
        if country in countries
                if !haskey(cummulated, country) cummulated[country] = zeros(ndays) end
                cummulated[country] .+= collect(data[i,5:end])
        end
end

day = collect(Float64, 1:ndays);
confirmed = hcat([cummulated[country] for country in countries]...)

plot(day, confirmed, xlim=(0, ndays+1), ylim=(10, 100_000_000), ylog=true,
     title="Confirmed SARS–CoV–2 infections", xlabel="Day", ylabel="Confirmed",
     labels=countries, location=4)
A 3D example
In the case of three-dimensional representations, e.g. surface plots, these can be rotated with the mouse. To do this, the mouse must be moved accordingly while holding down the left mouse button.
using GR
surface(peaks())
Conclusion
Even though the functionality shown here is still experimental in nature, it can already be put to good use. In a future version, simple editing options for plots will also be provided.
However, there are still some hurdles to overcome in order to integrate these functionality into Plots.jl. It is probably easier to implement all the functionality of Plots in a new GRM backend. The technical requirements for this would be given in GRM in any case.

Top comments (4)
It does not work
Can you provide covid19.csv so that we can reproduce your examples
You can download the file as described in this notebook.
Not working for me, using Julia 1.9.0 on Ubuntu 21.04.
No error message, but also no plot window appearing...