A few years back, I followed a course on Bayesian machine learning. Very early in the course, we were introduced to the Gaussian probability density function (PDF). We were presented with the equation that describes the univariate case. Soon after, we arrived to the following conclusion:
The multiplication of two Gaussian PDFs yields another (unnormalized) Gaussian.
This claim is quite relevant for Bayesian machine learning given that the product of two distributions is exactly what's going on in the numerator of Bayes' theorem:
The professor even walked us through the proof (e.g. like in here).
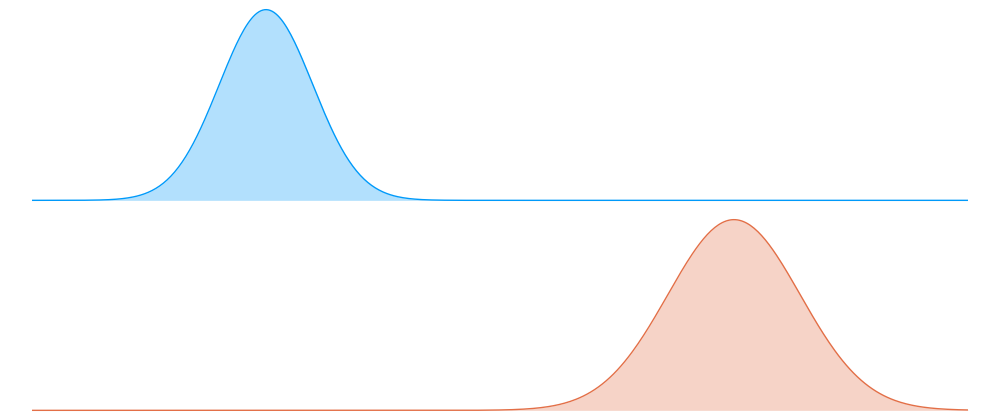
However, in my head, there was something that didn't click. I remember I asked myself 'Wait, you mean that if we multiply the following two Gaussian PDFs, which are quite displaced with respect each other, point by point, we still get another bell-shaped curve as a result? Don't they cancel out each other? Yes, they must cancel out...'
So yeah. I was skeptical. It was basically a battle between my intuition and mathematics.
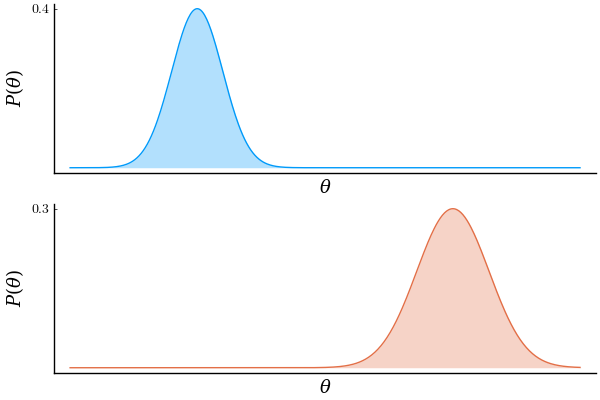
So in order to see who was right, I figured that plotting the result of this operation would tell. In the next figure, the top and middle rows correspond to the two operand Gaussians. The bottom row contains the 2 operand Gaussians and their product.
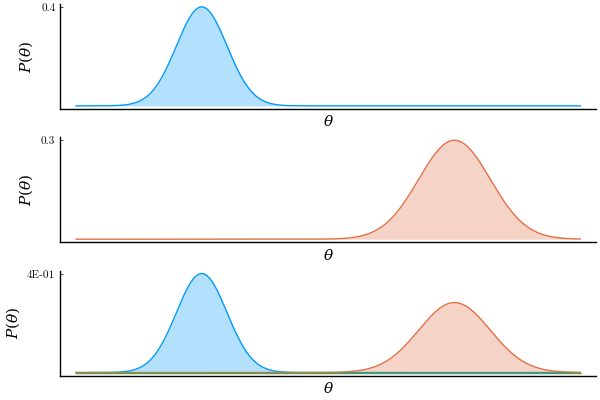
'I knew it,' I said when I first saw this result. If you look at the bottom plot closely, you can see a green line along the x axis, which is the result of the product. 'It cancels out!'.
Soon after I thought 'Hmmm, wait. What if the result is actually Gaussian but too small to see. I need a way to zoom in.' Luckily, Plots.jl makes it very easy to animate this kind of things. So I did.
using Plots, LaTeXStrings, Printf, Distributions
pyplot(f=true, fa=0.3, grid=false, xticks=false, size=(600, 400),
       legend=false, xlabel=L"\theta", ylabel=L"P(\theta)",
       fontfamily="CMU Serif", yformatter=y->@sprintf("%.1E",y))

θ = range(-10, 10, length=500)

d1 = pdf.(Normal(-5, 1), θ)
d2 = pdf.(Normal(5, sqrt(2)), θ)

p1 = plot(d1, yticks=[maximum(d1)])      # top
p2 = plot(d2, yticks=[maximum(d2)], c=2) # middle

ymaxr = [0.4/i^4.5 for i=1:50] |> x->vcat(x,repeat([last(x)],20))

anim = @animate for ymax in ymaxr
  p3 = plot(d1)                          # bottom
  plot!(d2)
  plot!(d1 .* d2, yticks=[ymax*0.97], ylims=(0,ymax))
  plot(p1, p2, p3, layout=(3,1))         # all
end

gif(anim, joinpath(@__DIR__, "anim.gif"), fps=10)
So yeah,
Mathematics: 1
Martin: 0

Latest comments (0)